|

Plastics consumption and GNI
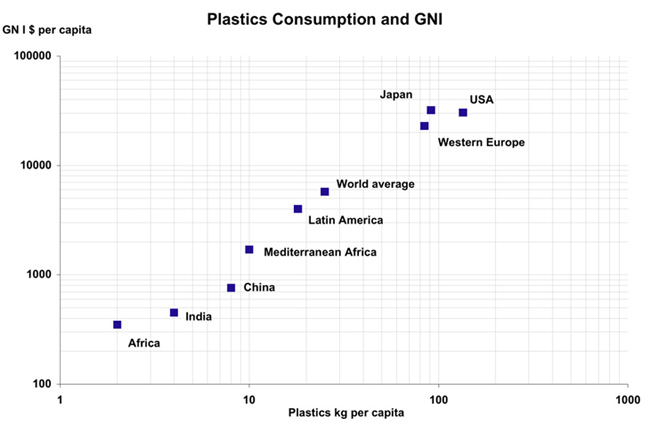
The log /log graph shows the narrow correlation between per capita plastics consumption in kilo and Gross National Income, GNI, in dollars per capita in various countries and areas in the world. Of course this is based on fairly rough estimates, but it is illustrative of the present relative situation of the world plastics markets, as correlated to the economic wealth, which is a truism of course.
An average GNI of $15,000 per capita, and more, means more than 60 kg of plastics per capita. An average per capita GNI of $2,500 or less means less than 15 kg per capita.
The world GNI per capita average of $ 5 700, means average plastics consumption of 25 kg. In 2020, the average GNI of $ 6 800 per capita, will shift to plastics consumption at over 70 kg per capita.

back to the top of the page |
|

